Geocoding with Tidygeocoder
Filed under:
Tidygeocoder is a newly published R package which provides a tidyverse-style interface for geocoding. It returns latitude and longitude coordinates in tibble format from addresses using the US Census or Nominatim (OSM) geocoder services. In this post I will demonstrate how to use it for plotting a few Washington, DC landmarks on a map in honor of the recent Washington Nationals World Series win.
First we will construct a dataset of addresses (dc_addresses) and use the geocode function from tidygeocoder to find longitude and latitude coordinates.
library(dplyr)
library(tidygeocoder)

dc_addresses <- tribble(
  ~name, ~addr,
  "White House", "1600 Pennsylvania Ave Washington, DC",
  "National Academy of Sciences", "2101 Constitution Ave NW, Washington, DC 20418",
  "Department of Justice", "950 Pennsylvania Ave NW, Washington, DC 20530",
  "Supreme Court", "1 1st St NE, Washington, DC 20543",
  "Washington Monument", "2 15th St NW, Washington, DC 20024"
)

coordinates <- dc_addresses %>%
  geocode(addr)
The geocode function adds longitude and latitude coordinates as columns to our dataset of addresses. The default geocoder service used is the US Census, but Nominatim or a hybrid approach can be chosen with the method argument (see the documentation for details). Our newly created coordinates dataset looks like this:
| name | addr | lat | long |
|---|---|---|---|
| White House | 1600 Pennsylvania Ave Washington, DC | 38.89875 | -77.03535 |
| National Academy of Sciences | 2101 Constitution Ave NW, Washington, DC 20418 | 38.89211 | -77.04678 |
| Department of Justice | 950 Pennsylvania Ave NW, Washington, DC 20530 | 38.89416 | -77.02501 |
| Supreme Court | 1 1st St NE, Washington, DC 20543 | 38.88990 | -77.00591 |
| Washington Monument | 2 15th St NW, Washington, DC 20024 | 38.88979 | -77.03291 |
Now that we have the coordinates we want to plot, we will use the OpenStreetMap package to make a map of DC.
library(OpenStreetMap)
dc_map <- openmap(c(38.905, -77.05), c(38.885, -77.00))
dc_map.latlng <- openproj(dc_map)
Note that the coordinates supplied to the openmap function above were obtained using openstreetmap.org (use the export button to extract coordinates). The openmap function downloads a street map and the openproj function projects it onto a latitude and longitude coordinate system so that we can overlay our coordinates, which is what we do next.
library(ggplot2)
library(ggrepel)
autoplot(dc_map.latlng) +
  theme_minimal() +
  theme(
    axis.text.y = element_blank(),
    axis.title = element_blank(),
    axis.text.x = element_blank(),
    plot.margin = unit(c(0, 0, 0, 0), "cm")
  ) +
  geom_point(data = coordinates, aes(x = long, y = lat), color = "navy", size = 4, alpha = 1) +
  geom_label_repel(
    data = coordinates,
    aes(label = name, x = long, y = lat), show.legend = F, box.padding = .5, size = 5
  )
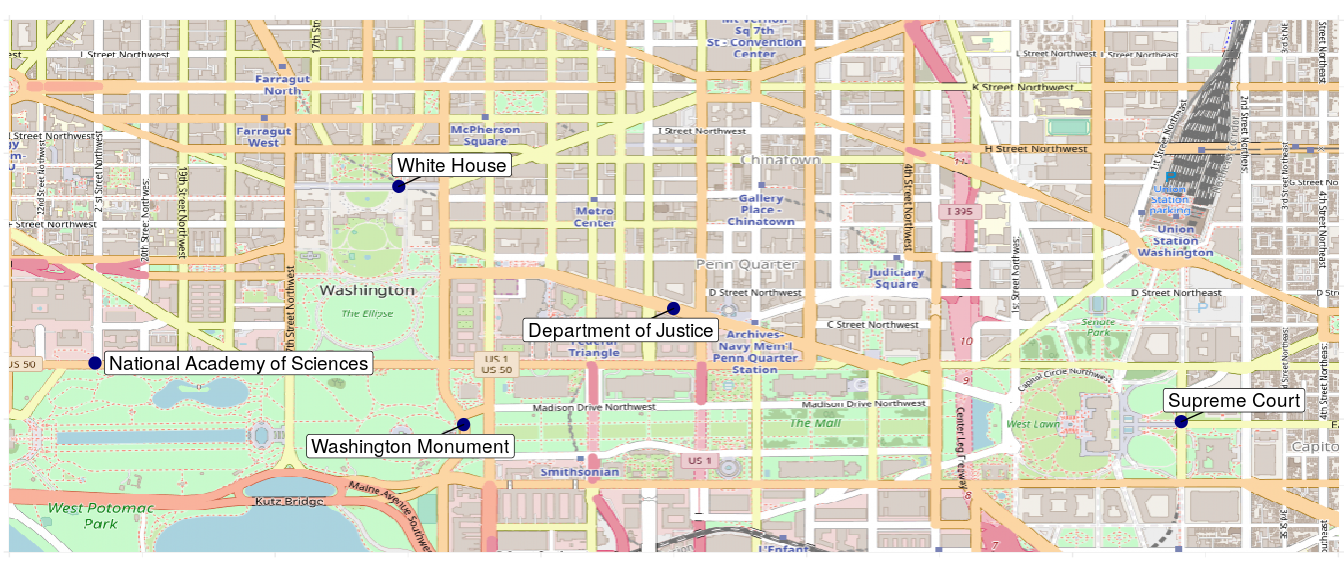
And that’s our map. The geom_label_repel function from ggrepel provides the text labels and geom_point from ggplot2 supplies the points. Alternatively, the leaflet package provides an excellent interface to plot coordinates on an interactive map. For more information on tidygeocoder, visit its home on GitHub or CRAN.